By:
Dave Kingsley
As a political scientist trained and experienced in statistics and psychometrics, I’m appalled by the by the lack of professionalism and scientific integrity in media polling enterprises such as the New York Times Quinnipiac and Siena college polls. For instance, the contents of an article appearing in the New York Times today (October 11th) under this headline (above the fold): “New Poll Shows G.O.P. Edge to Seize Senate” is terribly irresponsible journalism. These down and dirty little polls are nothing more than pseudoscience and charlatanism. They serve the need of print media to attract interest and sell advertising. Unfortunately, they also influence public opinion and voting behavior.
The polls at issue in the article pertain to the races of Democrats John Tester in Montana, Collin Allred in Texas, and Debbie Marcasel-Powell in Florida. Based on a faux-scientific “Times/Sienna” boiler room calling operation and some mindless mathematical calculations, the article headline on page A9 blares “New Poll Shows the G.O.P. With an Edge to Seize Control of the Senate.”
The implication is that Tester and Marcasel-Powell are finished, and, therefore, the Republicans will take back the Senate. This article will certainly put some wind to the back of the Republicans. A couple of hours after I read the article in my print edition, I saw and heard anchor person Anna Cabrera on MSNBC ask a field correspondent if “the race was slipping away from John Tester.” He indicated that it indeed did seem that way.
Commonsense should tell us that a poll accompanied by an article indicating that an election is all but settled a month out from that election discourages one side or the other from supporting the predicted loser in the form of money and/or volunteer effort. Worse than these effects on political behavior are the noise and confusion injected into public discourse by the proliferation of unscientific polling businesses.
The unbelievable increase in pollsters has poured a stream of noise into public discourse that contributes nothing to enlightenment regarding policy. Rather they cause unnecessary worry, anger, discouragement, and mindless conformity. The results of a recent study in the International Journal of Public Opinion suggests that poll results cause a “bandwagon effect” on voting behavior. Other research validates this by showing that the normal human tendency to conform – often subliminally – leads to support for the candidate who is presented as the likely winner in polls.
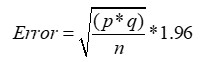
Pollsters add a patina of science to their nonsense by a mindless calculation they call the “margin of error.” From the perspective of statistical theory, their understanding and interpretation of their simplistic calculations are laughable. Nevertheless, talking heads on every major news outlet parrot this nonsense by repeating something like “that is within the margin of error.”
NOTE: See the post accompanying this post if you are interested in a slightly technical explanation of what pollsters call “margin of error.” If you don’t want to take time to work through the explanation, I fully understand that. You can take my word for it. I’ve taught it. I’ve applied it in my own research. And I can tell you with absolute certainty that the New York Times and their little-known colleges looking for branding are misusing statistical theory that has little to do with the kind of gross error involved in the political polling business.
The New York Times isn’t engaged in science as they would have you believe. They are creating a narrative that they hope keeps you on the edge of your seat, your eyes on their newspaper (and advertising), and anxiously awaiting the next poll. Nothing sells like fear and anxiety.
How arrogant is it for journalists and media outlets to act as soothsayers and intermediaries in U.S. elections by predicting who is likely to win an election based on their faulty form of data collection and analysis? Their job is to tell the truth as best they understand it. They should not be engaged in reporting their own bad science and influencing elections.
As Neil Postman warned us a few decades ago in his classic little book Amusing Ourselves to Death, “In the age of show business, public discourse will become dangerous nonsense.” And thus, it has. So-called political polling does nothing more than add more noise in the stream of noise that now constitutes political discourse. Noise becomes really dangerous when it is passed off as science. In the current climate of scientific nihilism, any ridiculous claim to scientific legitimacy can be made palatable with numbers. New York University Professor Journalism, Charles Seife, put it this way in his book Proofiness: The Dark Arts of Mathematical Deception: “If you want to get people to believe something really, really stupid, just stick a number on it. Even the silliest absurdities seem plausible the moment that they’re expressed in numerical terms.”