By:
Dave Kingsley
Political Economy Accounts for the Effects of Propaganda – Orthodox Economics Do Not
The focus of this blog is on economics, finance, and politics – we could more aptly say that we conduct research and write about “political economy.” As opposed to orthodox economics – overwhelmingly taught in the academy and practiced by most professional economists these days – political economy considers the cultural, historical, and political, context of the economy.
In the current cultural context, an increasingly high tolerance of lying, and intentionally misinforming the public has been developing since the Reagan Revolution. A survival of the fittest, winner take all, hyper-competitive capitalism has become intertwined with money in politics, boosting venal politics. This is having a major effect on how federal spending is presented to the public.
Propaganda
Propaganda has become a noticeable feature of public discourse on federal funding. By propaganda, I’m referring to intentional disinformation, i.e., lying, plus the individuals and organizations that wittingly and unwittingly disseminate it. As the venality of politics increases, there is a proportional increase in significant amounts of propaganda. For instance, in the past few decades, the late Wall Street mogul Peter G. Petersen funded several “inside-the-Washington, D.C.-beltway think tanks” for the purpose of selling the public on the belief that this country – the richest country on the planet – can’t afford to fund a decent level of retirement security, e.g., Social Security, SSI, medical care, e.g., long-term care, housing, and other programs for a dignified and humane old age.
I have already blogged somewhat about Petersen’s phalanx of organizations such as The Committee for a Responsible Federal Budget, The Concord Coalition, and The Bipartisan Policy Committee. The boards of these organizations include prestigious individuals from government, the military, business, and super-rich families. Former congresspersons who have behaved suitably while in office often serve as board members or high paid executives of these special interest “think tanks” which pass themselves off as legitimate research institutions, when in fact they are propaganda machines.
Petersen’s Billions for Propaganda Have Had a Huge Impact on Budget Beliefs
If you are looking for information on the federal budget, you can find some nice looking, colorful, pie charts online that are simple, easy to understand, and wrong. The pie chart below is nothing less than a lie. This representation of the 2019 budget has been typical of what has been disseminated over the past several decades. The 2020 budget will be atypical due to COVID and would muddy the waters somewhat on this post, which addresses enduring concerns.
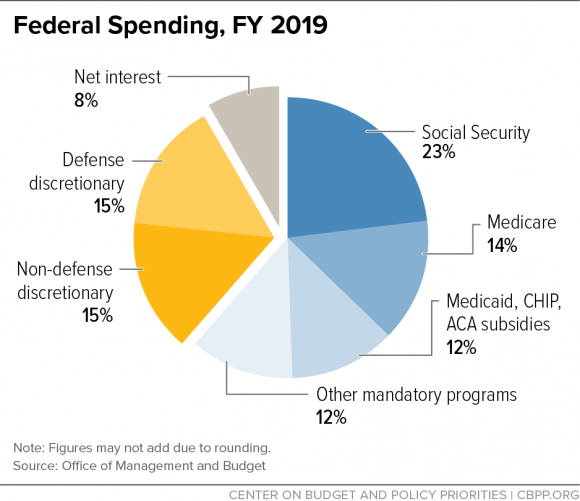
The above chart illustrates the percentage of “federal spending” that is allocated to major categories such as Social Security and defense. This is typical of what one finds when Googling the federal budget. This chart is disseminated by the Committee on Budget & Policy Priorities (https://www.cbpp.org/research/policy-basics-introduction-to-the-federal-budget-process). The CBPP is usually on the progressive side of issues, but they are on board with the pervasive misinformation regarding the budget. Unfortunately, misinformation about the federal budget dominates public discourse.
Social Security is “Off Budget” by Law: It Only Makes Sense that it Would Be.
What’s wrong with the information on the above chart? Although the data are purportedly “budget data,” they are not. The title of the chart is “Federal Spending FY 2019,” which is a rather slick maneuver, because it appears in a document entitled “Introduction to the Federal Budget Process.” No doubt, Social Security is a component of federal spending, but it has nothing to do with the budget. “In the 1983 Social Security Amendments a provision was included mandating that Social Security be taken “off-budget” starting in FY 1993” (https://www.ssa.gov/history/BudgetTreatment.html#:~:text=Research%20Notes%special%20Studies%20by%20the%20Historian%27s,%20%24567%20billion%20%201%20more%20rows%20).
Expenditures on Social Security are from a dedicated payroll tax, benefits are actuarially determined based on individual accounts, and no general fund transfers are made to the program, which cannot run a deficit or borrow money. Benefits would be reduced if revenue could not meet payout earned by beneficiaries. So, to display it as 23% of the federal budget is false. Furthermore, prior to 2020 and the COVID crisis, Trust Fund balance of $3 trillion had accumulated. This was not counted against the deficit.
In 2019, Only 42.6% of Medicare ($339.8 billion) was Transferred from the General Fund.
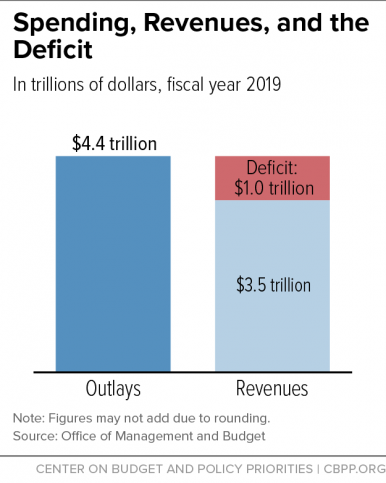
The pie chart above pertains to a mythical budget of $4.4 trillion (see bar chart below). Medicare is shown as 14%. However, only 42.6% ($339 billion) of total Medicare expenditures of $796.2 billion is appropriated through the federal budget process.
Instead of 14% of the total federal budget of $4.4 trillion, Medicare is less than 8%. That is, if the federal budget is actually $4.4 trillion, which it isn’t. Social Security must be eliminated. There can be no argument about that. Approximately $1.5 trillion in tax expenditures should be added, which would result in a total budget of nearly $5 trillion.
Tax expenditures are subsidies provided to corporations and individuals through the tax code. “The Congressional Budget Act of 1974 (Public Law 93-344) requires that a list of “tax expenditures” be included in the budget” (https://home.treasury.gov/system/files/131/Tax-Expenditures-2021.pdf, p. 1). You may have noticed that they never show up on impressive pie charts? So, for instance, subsidies to employers for health insurance provided by employers to their employees ($228 billion – the biggest tax expenditure) are not included in charts provided by think tanks. Capital gains, employer defined benefits and defined contribution programs, accelerated depreciation, and a large number of other tax subsidies, most of which benefit high net worth individuals and corporations (including the long-term care industry), are major subsidies that cost taxpayers and put pressure on other forms of revenue.
Although Social Security & Medicare are a Small Part of the Federal Budget – they are Blamed for the Deficit
Social Security is not part of the $5 trillion federal budget. So, the $339.8 billion transfer from the general fund for Medicare, which had total expenditures of $796 billion, mostly paid for with premiums, co-pays, deductibles (out of pocket or OOP expenses), and the payroll tax is on budget. Hence, the entire $1.8 trillion expended on Social Security and Medicare only accounts for 6.8% of the entire federal budget.
The media will parrot press releases produced by the organizations responsible for budget propaganda. Advocates, and activists have a duty and obligation to debunk and rebut these lies about cherished programs for the elderly.