
By:
Dave Kingsley
How many times have you heard a talking head say that a poll result is “within the margin of error?” It is important for the viewing audience or readers of print media to know that the media is merely parroting nonsense flowing from the polling industry, which is basically in the business of producing junk science. Unfortunately, media representatives do not understand the simple calculations pertaining to the “margin of error” and how these calculations relate to mathematical theory. It is not the mindless calculations that are wrong. Rather it is the statistical theory that requires serious thinking that is consistently ignored.
Aside from the calculations, most explanations of “margin of error” I find on the internet are incorrect. Talking heads and print journalists certainly do not understand what it means as they report ad nauseum, ad infinitum on pollsters’ never-ending supply of pseudoscience.
The margin of error is of necessity utilized erroneously when it is applied to political polling. MSM talking heads and writers don’t understand that the ME is based on theoretical, mathematical statistics and assumes specific conditions, which are not and cannot be met by pollsters. Let me explain.
Researchers must have strong evidence that a sample from which responses are obtained is selected randomly and is a very close representative of the population from which it is obtained. Given a scientifically suitable level of randomness, an error rate is estimated at a confidence level chosen by individual researchers. Typically, confidence levels are set at 95%, which means that if the exact same population was resampled in the exact same manner 100 times, the true population mean would fall within each separate calculated confidence interval 95 out of 100 times.
The theory from which this is derived is known as the “binomial standard error” which is simply [(p*q)/square root of n]*1.96.
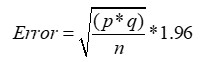
Where: P is the percentage responding to one option in a poll, Q is the percentage responding to the other option, and N is the number of individuals (respondents) providing a response.
The “1.96” value can be explained this way:
If the poll were conducted 100 times in the exact same manner with respondents from the exact same population, the distribution of results, i.e., p and q would be normal, i.e., like a “bell curve” or what is mathematically known as a Gaussian Curve. On can expect that under these conditions the population p will fall within ±1.96 standard deviations from the sample mean (p) in 95 out of 100 samples. It is not the case that there is a 95% probability that the true population p is within ±1.96 standard deviations of the sample p.
Example: 1,000 responses are obtained through calls to prospective respondents. Let’s assume unrealistically that exactly 53 percent respond that they will vote for candidate A and 47 percent respond that they will vote for candidate B. Further, let’s assume unrealistically that those responses are “random” and a representative sample of the population from which respondents are randomly selected. The ME for that sample would be:
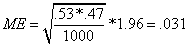
The correct mathematical interpretation of this result would be that the estimated true population mean for p is .53 ±.031 or between .561 and .499 or, conversely one could assume that estimated mean for q is .47±.031 or between .501 and .439. However, that estimated p could be one of the 5 out of 100 samples in which the true population p falls outside of the estimated range.
In a presidential election, it is very easy but meaningless for a pollster to say they got it right. They hedge well because presidential elections tend to be close. It is hard to imagine that the results would be 56.1 percent to 43.9 percent in any presidential elections held today. Therefore, if pollsters overwhelming suggested that Hillary Clinton would win but she lost, they can always claim they weren’t wrong because the results fell within the margin of error.