Given all the palaver about “Baby Boomer” hordes about to descend upon the health care system, you might think that the rest of the U.S. population is shrinking. That would be wrong – way wrong. In fact, the overall growth of the population in this country presents real problems to a political-economic system with disappearing jobs, shrinking educational resources, diminished government services, and an increasingly polluted and wasted environment.
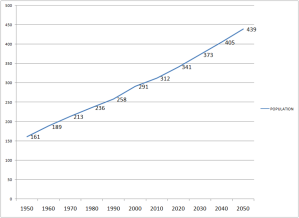
The demographic information presented in this post has come mostly from the U.S. Census Bureau. One would be hard pressed to find a professional demographer who disagrees with it. The graph at the bottom of this post displays U.S. population growth in millions (Y axis) for the years 1950 to 2050 (X axis). As you can see the population between 1950 and now, practically doubled – from 161 million to 312 million. However, in the next 30 years, another 128 million people – roughly one and one-half Irans – will be added to the U.S. Only 48.3 million of this growth will be in the 65+ age category. That leaves a population growth of nearly 80 million in the under 65 age category.
The “Baby Boom” child cohort peaked at 70 million in 1964. The under 18 population remained at about 70 million for a few years and then declined gradually until the mid-80s when it bottomed out at 64 million. This was a “dip” but not a bust. There was never a “Baby Bust.” Neither was there an echo. The child population began to grow again and reached 70 million again in the mid-90s and has never quit growing. As the table immediately below indicates, there are now 75 million children in the U.S. This will grow to 101 million by 2050! WHY IS NO ONE TALKING ABOUT THIS?
| 2010 POPULATION | 2050 POPULATION | CHANGE: 2010 TO 2050 | |||||
| AGE CATEGORY | POPULATION(MILLIONS | % OF TOT.POP. | POPULATION (MILLIONS) | % OF TOT. POP. | GROWTH (MILLIONS) | % GROWTH | % OF TOTAL GROWTH |
| 0 TO 18 | 75 | 24.5 | 101 | 23.0 | 26.3 | 35 | 20.4 |
| 18 TO 65 | 194 | 62.8 | 249 | 57.0 | 54.1 | 28 | 42.0 |
| 65+ | 40 | 13.0 | 88 | 20.0 | 48.3 | 120 | 37.5 |
| 85+ | 6 | 2.0 | 19 | 4.0 | 13.2 | 231 | 10.0 |
| TOTAL | 310 | 100.0 | 439 | 100.0* | 128.0 | 42 | |
*The 85+ group is counted twice – as part of the 65+ category and broken out as a separate group.
It is easy to be misled by the difference between absolute growth and relative growth. In relative terms, the 85+ group will grow by 231% by2050 while the 0 to 18 population will grow by 35%. However, in absolute growth (absolute numbers), the 85+ population will add 13.2 million while the 0 to 18 population will add 26.3 million. Approximately 63% of the population growth will come in the under 65 age categories.
I will leave the readers of this post with the following question: “Why is the press, the government,and just about every other influential institution ignoring the unsustainable population growth thatwe are now experiencing?” It is unsustainable in the current U.S. living and governing mode.
U.S. Population Growth – 1950 to 2050

